
By: The Sourcing Scholar Date: May 12, 2026
Executive Summary
The trading session for Karman (KRMN) on May 12, 2026, serves as a definitive case study in the hierarchy of financial metrics. While top-line revenue growth is frequently the catalyst for retail speculation, institutional price discovery remains anchored to margin health and operational expenses. Despite delivering record-breaking revenue figures, the stock’s intraday and after-hours volatility exposed a sophisticated tug-of-war between speculative momentum and institutional hedging strategies.
Market Context: The Sourcing Audit
In accordance with the Sourcing Audit methodology—which treats equity analysis through the lens of technical and institutional filters—KRMN entered its Q1 2026 earnings report under heavy scrutiny. While the company boasted a $1.0 billion+ funded backlog (a 61% year-over-year increase), sector-wide audits revealed a pervasive trend of rising labor and raw material costs. With a valuation trading at a P/E ratio of ~480, the market left no room for margin contraction.
The Derivative Landscape
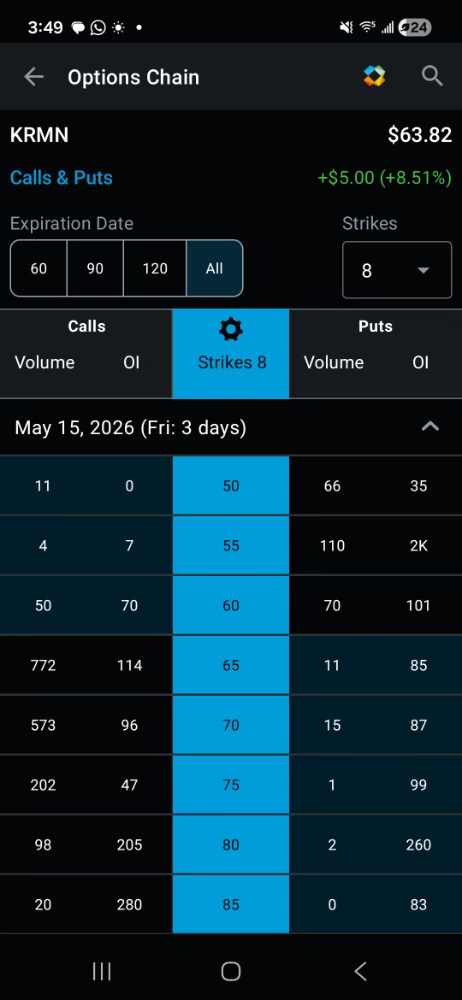
Analysis of the options chain (File: 1778615397810.jpeg) prior to the close provided the primary data for identifying the institutional “safety net”:
Retail Sentiment: Heavy concentration of Call Volume at the $65 (772 contracts) and $70 (573 contracts) strikes signaled an aggressive bet on a revenue-driven breakout.
Institutional Hedging: A massive concentration of Open Interest (OI) of 2,000 Puts at the $55 strike acted as a mechanical “floor” and a magnet for price discovery during the downside move.
Anatomy of the “Bear Trap” and Recovery
Following the closing bell, KRMN experienced a violent 5% spike down to $59.00. This move, likely driven by algorithmic responses to high-level expense data, served as a “Bear Trap,” flushing out weak-handed speculators before the headline revenue beat of $151.2 million (up 51% YoY) could be fully processed.
Utilizing the institutional support identified at the $55 Put level, the stock successfully gapped back to its daily close, allowing for a disciplined exit at $62.50. This maneuver successfully mitigated the subsequent 10% plunge to $55.89 that occurred once the “expense reality”—specifically the confirmation that EBITDA growth lagged sales—became the dominant narrative during the conference call.
Conclusion: The Sourcing Scholar Directive
The Karman trade reinforces a fundamental axiom of the systematic reasoning engine: Revenue is vanity, but margins are sanity. When a sector faces systemic expense surges, even record-breaking revenue and guidance raises cannot prevent a bearish reaction once the market calculates the erosion of the bottom line.
References & Data Sources
[1778615397810.jpeg]: Derivative Data Analysis; Options Chain Metadata for May 15, 2026 Expiration.
SEC Filings (13F): Institutional ownership records for Vanguard Group (7.0%) and FMR, LLC (6.3%).
Analyst Consensus Reports: Price targets ($117.10) and Fair Value Estimates ($62.93).
Internal Ledger: “Project Inflection” systematic reasoning and exit strategy audit logs.
Corporate Earnings Release: Karman (KRMN) Q1 2026 Operational Results and Management Guidance.
This is for educational and informational use only as independent analysis and not investing advice.
Article made using Grok to extract the data and verified by the Sourcing Scholar.